www.InvestorsHELP.net
  • Welcome
  • Subscriber's Vault 2019
    • Subscriber's Vault 2018
  • For Traders & Investors
    • Trading Options
    • Learn Forex With Cindy
    • Meet_Trader_Cindy
    • ICHIMOKU Strategies
    • Candlestick Profits
    • Low Freq. Algo. Trading
    • Weekend Warriors
    • AAII -- Al Zmyslowski
    • Watchlists and Market Tech Tips
    • AAII -- SumGrowth Special Interest Group
    • MACD Divergence Alerts
    • IPOs -- Joe Gruender
    • SVOG -- Videos >
      • SVOG -- Slides & Spreadsheet
    • Stress Relief
    • Get Up To Speed
    • Mentors
    • Presentation Slides
  • SectorSurfer
    • Stocks & Commodities Mag. Article
    • SectorSurfer -- Meetings >
      • SS Meetings & Videos
      • SS Seattle -- Sept. 2016
      • SS Seattle -- Apr. 2016
      • SS Meeting -- Mar. 2016
      • SS Seattle -- Feb. 2016
      • SS Seattle -- Dec. 2015
      • SS Seattle -- Oct. 2015
      • SS Meeting -- Sep. 2015
      • SS Seattle -- Aug. 2015
      • SS Seattle -- July 2015
      • SS Meeting -- May 2015
      • SS Meeting -- Mar. 2015
      • SS Meeting -- Jan. 2015
      • SS Meeting -- Nov. 2014
      • SS Meeting -- Sept. 2014
      • SS Meeting [R] -- July 2014
      • SS Meeting -- May 2014
      • SS Meeting -- Mar. 2014
      • SS Meeting -- Jan. 2014
      • SS Meeting -- Nov. 2013
    • SectorSurfer -- Monthly Perspective
    • Strategy of Strategies -- Scott Juds
    • Chief SectorSurfer -- Scott Juds
    • Best SectorSurfer Portfolios -- Dec. 2013 >
      • SectorSurfer Portfolio -- Lowest Drawdown
      • SectorSurfer Portfolio -- Most Impressive Ride
      • SectorSurfer Portfolio -- Highest [Score]x[Safety]
      • SectorSurfer Portfolio -- Honorable Mention Awards
    • SumGrowth -- Special Interest Group At AAII (LA)
  • Timing Winning Stocks (TWS)
  • Welcome
    • Blog -- InvestorsHELP.net
    • What's New Now?
    • Coming Events?
    • Active Trend Trading System
    • Recommended Reading
    • Videos On Demand
    • Our Special Kids
    • Why The Ads?
    • Why InvestorsHELP.net
    • Why Subscribe?
    • Video Library (Coming Soon) >
      • Library (Sorted by Category)
      • Monthly Videos -- Click Here >
        • New Videos - July 2014
        • New Videos - June 2014
        • New Videos - May 2014
        • New Videos - Apr. 2014
        • New Videos - Mar. 2014
        • New Videos - Jan. 2014
        • New Videos - Nov. 2013
        • New Videos - Oct. 2013
        • New Videos - Sep. 2013
        • Subscriber's Vault >
          • CI-MI Group >
            • More -- Al Z.
          • Peeks' Stock Forum >
            • Top Industrial Groups
            • Top 50 Stock Report
            • Top 50 Stock Report [ADX-ICHIMOKU]
            • Top Picks -- Stringent Criteria
          • TOPS Group -- PJ Scardino
          • Options -- Tom Sosnoff
          • SS Videos -- May 2014
          • Strategy of Strategies -- Details
          • Special Informative Videos
          • SVOG -- Eversley Forte
          • Trendlines -- Charles Bassetti
  • Trader's Health & Wellness
  • Novice_Trader_Cindy

11.6% Profit In 6 Minutes -- How Is This Possible?

1/22/2018

0 Comments

 
Good Morning fellow traders and investors, we hope that you are having a very profitable day.  The shortened week that just ended last Friday began ominously with a market  reversal session that caused some consternation for all of us.  We don't want to see new highs being made in the morning to have them all given up by the close, especially on heavy volume. 

The high volume that we experienced was an indication of institutional selling, but by week's end, the major average had clawed its way back to close at all time highs.  Talk about resilience!  For our subscribers who follow IBD, l
et's take a look at the distribution day count.

To refresh your memory, distribution is an indication of institutional selling.  When distribution days start to pile up, particularly when you see them clustering over a period of a week or two, you need to pay attention, because that could set the stage for a more severe market sell-off. The Nasdaq has only had two since December 14th, hardly an ominous sign.  The S&P 500 matches that number, so we're not seeing tell-tale signs of institutions cutting and running.


Does that mean the coast is clear?  No, but it's an indication at this point, investors are in the mood to buy the dips and pour more money into the market.  Nobody knows how long this will last, but suffice it to say, it will last until buyers are exhausted.  Near tops, you will see distribution days start to occur and they can add up very quickly, so don't be complacent.
I'm seeing some stocks breaking above longer term up-trend lines. 

On a chart, connect at least three points going back at several months.  A strong acting stock in a prolonged up-trend will often establish these point at intermittent highs.  You can draw a line connecting the highs of these points to help identify likely areas of resistance.  When a stock breaks above this long term upper channel line, it's doing something out of character.  This could be a sign of climax price action, a place where stocks could have a blow-off top. 

When you see a stock start to behave in this fashion, watch it closely because studies have indicated that when this happens, stocks should be sold.  We 
recognize human nature being what it is, you're reluctant to sell as long as your stock is going up.  Therefore, you might consider selling some and keeping some shares until you see weakness.  Just remember, stocks go down a lot faster and harder than they go up, so be happy when you have a chance to unload some of your shares before they top out.

Right now, the trend remains our friend.  We currently have the government shut down that might have an affect on the market this week?  So far this morning, the markets are up.  

Now that this bull market is getting pretty old, it started in March 2009, some of our subscribers are asking us how do we make profits more quickly, not staying in the markets when risks are high?  Here's an example of a very quick trade that we took this morning:
Picture
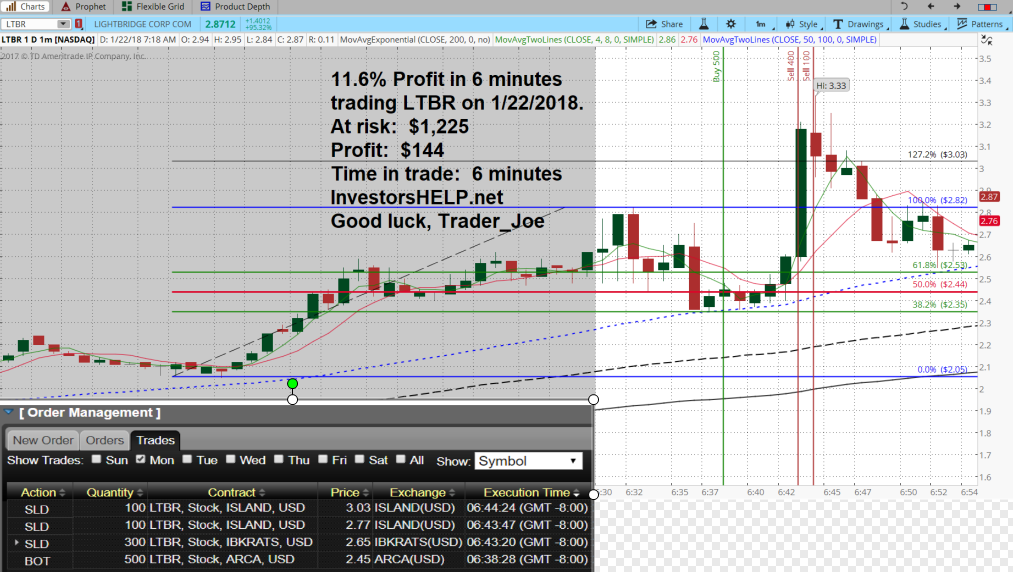
The above photo shows a 6 minute trade that I took this morning.  I had gotten up too early, around 4:30 AM CA time, and was thinking about going back to bed.  So I decided that I would look for a quick trade where I have a high probability of taking a profit in 10 to 20 minutes and then go back to bed until later this morning.  So, some of us refer to this as a scalp trade.  He is the basic concept:

1.  Do a scan to find a low price stock that has a "gap-up" in the premarket, Look for a stock priced  between $1 to $10,
2.  Look at the news for the symbols you find that are of interest to you,
3.  Review the premarket price pattern as it forms on the 1 minute chart,
4.  Watch for an ideal time to buy the stock within a short time after the market opens based on a price action that you like,
5.  Buy the stock, usually a quantity of several hundred shares, and closely watch the price action on your 1 minute chart, and
6.  Quickly sell all of your shares when the price of the stock shoots up like a rocket!

That's exactly what I did this morning as shown in the above price chart of Lightbridge Corp. [LTBR].
After doing my premarket scan on my Think Or Swim [TOS] platform, I identified LTBR as a possible scalp trade.  I began watching this stock in the premarket on my 1 minute chart.  At the open, price tried to move up, but I waited for the first pullback and then bought on the pop up as shown above on the green line. 

After watching the price action for a few minutes, I prepared three exit orders as shown in the "Trades Box" shown above.  I wanted to take profits on 300 shares quickly, then try to grab some additional profits on the remaining 200 shares.  These closing trades are shown by the two red lines on the chart.  Total time in the trade was only 6 minutes, but it did take me about 20 minutes of research and analysis work before placing my first trade.  Still not bad, especially when you consider that the trade generated about $144 in profits!

If you would like to learn more about doing these types of "scalp" trades, please drop me a line by clicking on the comments tab, or send me an email to:  [email protected] and tell me more about what you would like to learn through our website at:  InvestorsHelp.net.

​Good Luck,  Trader_Joe


0 Comments

TradeStation FREE Commission Offer Also Applies To "First Responders"

1/7/2018

0 Comments

 
Hi Fellow Traders and Investors,

In my previous blog post regarding FREE commissions for active duty military and veterans at TradeStation, I forgot to mention that this also applies to "first responders."

Sorry about that.  As a retired USAF career officer, I have been using this FREE service for a couple of months and love it!  I pay only $0.06 per trade for market fees.  Check it out and save some money!

Trader_Joe
Founder, InvestorsHELP.com
Picture
0 Comments

Latest News: SectorSurfer Event -- Commission Free Trading -- Straddle Video

1/7/2018

0 Comments

 
Picture
------------------------------------------------------------------------------------------------------------------------------------------

​Get all the details by clicking on the below link:

archive.aweber.com/investorshelp/G5OGS/h/InvestorsHELP_Attention.htm

Have a great weekend and then let the profits continue to roll in during the remainder of January!

Good luck, Trader_Joe
Founder, InvestorsHELP.com
0 Comments

Really? 214% Profits In Less Than 2 Weeks?  Show me how!

12/5/2017

0 Comments

 
Hello Fellow Traders and Investors,

The market seemed very quiet today.  So I thought this would be a great time to continue the blog topic Trader_Joe began a few days ago on options trading over earnings. 

As Joe mentioned, in late November we researched companies with earnings in the near future.  Lowes (LOW) had earnings pre-market on November 21st.  The estimated earnings was $1.0284 and actual was reported at $1.05.  Though price gapped down at the open, after taking into consideration that earnings exceeded the estimate, an analysis of our indicators and the upcoming holiday season, we decided to go into an earnings play on LOW. 

As Joe mentioned, if we anticipate price moving up and volatility is high, generally we want to sell a put.  If we anticipate price moving up and volatility is low, generally we want to buy a call.   But this isn’t set in stone, as the case with LOW.

When selling a put, the maximum profit potential is limited to the amount of premium collected when the put is sold.  The premium goes directly into your account.  But when buying a call, the maximum profit is unlimited.  After reviewing everything mentioned above and anticipating a large move up in price, we decided to buy calls on LOW. 

On November 21, we bought 3 call options at $81.50 expiring 12/22/17. 

As we said above, LOW price had gapped down at the open, but began to move up during the day.  The next three days were red candles, which means the price of the stock closed lower than the open.  We anticipated this being a possibility and that’s why we went with an option 30 days out instead of only a week or two.  

We closed the first option on 11/29 with a 16% profit.   We closed the second option with a 64% profit on 11/30.  Price action on 12/4 began with a slight gap up and began climbing.  We decided that this would be a great day to close our final option, which we did for a profit of 214%!

The take-away for a new trader is if you anticipate a stock price moving up, the general rule of thumb is to buy a call when volatility is low and to sell a put when volatility is high.  This is not set in stone and other factors/analysis can lead tell the trader to place trades opposite the general rule. 

We hope that you are finding this information on our trades helpful to you.  These blog posts should especially be helpful to those of you who are newbies (new to trading) since there is so much to learn especially on trading options.

Happy Returns!
Trader Cindy
Picture
0 Comments

VMW -- 100% Realized Profits in 6 Days and 4 Days

12/3/2017

0 Comments

 
Hi Fellow Traders and Investors,

We hope that you had an enjoyable weekend and are getting ready for an interesting week ahead in the financial markets.  This should be an interesting week especially since Congress is getting closer to finalizing a tax cut for most of us and also that our military will be conducting war games (practice we hope) with our allies in South Korea.  Therefore we should see some high volatility, just what we like, for capturing profits in the markets.

As promised a couple of days ago, I am going to share with you what we traded and how we traded it earlier this past week.  The purpose of doing this to share with newbies what InvestorsHELP.net is doing to generate excellent profits when it comes to options.  For our more experienced FREE subscribers, this is pretty basic information and I am sure that you may want to add some words of wisdom using the "Comments" tab. 

In late November we were doing some research on companies that were releasing their earnings in the near future with the idea of finding an excellent candidate for selling cash secured puts.  Our research, coupled with our technical indicators, identified VMware (VMW) as the right candidate for us to select for this trade.

With earnings to be announced on Nov. 30th after market close, we selected the weekly puts at a strike of $120 to be sold for a premium of $1.10 per put sold which were scheduled to expire at close of market on Dec. 1st.

Two days later we noticed that the implied volatility continued to increase and the options became more expensive, so we sold additional weekly puts at a $115 strike and collected premiums of $1.70 per put sold on Nov. 29, the day before earnings release.

Risk: if price at close on Friday, Dec. 1st, would have been less than $120 or less than $115, the puts would have been exercised and we would have ended up owning a lot of VMW stock.  This risk was acceptable to us since we had no problem owning VMW especially when we could/would have sold calls against this stock on Monday, Dec. 4th.

As it ended up, we were right in our analysis, VMW stock was not put to us, and we collected a lot of premium ($$$$) which we now have available for trading this week.

We hope that you are finding this information on our trades helpful to you.  These blog posts should especially be helpful to those of you who are newbies (new to trading) since there is so much to learn or new to trading options.

We hope to share some of our pending trades with you this week.  Be sure that you have signed up to be a FREE subscriber at InvestorsHELP.net so that we can keep you informed.

Good Luck this week,
​Trader_Joe

Picture
0 Comments

ULTA -- InvestorHELP.net After Earnings Play on ULTA

12/1/2017

0 Comments

 
Hi Fellow Traders and Investors,

​This afternoon I was getting ready to close up shop for this week and noticed a big selloff in the price of ULTA after earnings were released.  In my opinion, this selloff is overdone especially based on ULTA results for last quarter and the fact that we are coming into the holiday season.

Therefore I decided to sell the $190 puts on ULTA at 10:20 AM PST which expire next week on 8 Dec 2017.  I picked the $190 strike because of previous support around this price as shown below on the daily chart of ULTA.

This is a very short term trade of only 1 week, with the risk of having ULTA shares put to me if price is below $190, which is acceptable to be.  I have no problem with owning ULTA, especially when I can sell calls after ULTA is put to me.  Another win-win situation if you ask me.

Therefore I sold ULTA puts this afternoon and hope to generate $100+ next Friday on each put sold.

Please do your own research if you too are thinking about selling puts on UTLA.

Good Luck, Trader_Joe
Picture
Picture
0 Comments

VMware (VMW) -- Time For An Earnings Play?

11/28/2017

0 Comments

 
Hi fellow traders.  Several of our subscribers have been asking us to share information regarding our current trades.  So, here is a trade that we entered into yesterday in which we sold the $120 puts on VMW.  Earnings will be announced on 11/30/2017. 

Notice on the chart shown below that implied volatility (IV) is very high and that means we want to "sell" puts at this time.  [IH Tip:  when IV is high, you sell options and when IV is low, you buy options].  IV is the green line that is shown near the top of the chart.

Since the IV is very high on VMW, and the earnings is this week, yesterday we sold the $120 puts which will expire on Friday, after the earnings announcement which is on Thursday.

IH plan:  on Friday, we will either buy back our puts at a lower price or allow the stock to be put to us depending on the opening prices on Friday morning.  If the stock is put to us, we will sell calls on Monday (covered calls) expiring next Friday and continue to generate premium until the stock is called away from us.  A win-win for us, especially since we don't mind owning VMW.

​Good Luck to everyone, but remember to do your own research before entering a trade,
Trader_Joe
Picture
0 Comments

Facebook (FB) --- A Technical Analysis

9/13/2016

0 Comments

 
What's Going With Facebook?  Based on subscriber requests, here are my latest perspectives on this popular and volatile stock for your review and analysis.

CHECK IT OUT -- CLICK ON BELOW SLIDE
Picture
0 Comments

How Can You Profit When Using "Turn Around Tuesday?"

7/4/2016

1 Comment


Have you ever heard about or used this tip regarding Tuesdays in the financial markets?  Several of our subscribers have not, so we prepared this video just for you.  Please click on the video below.  

Picture
1 Comment

Market Recap Ending 10.09.2015

10/11/2015

3 Comments

 
Picture
What a Week In the Markets!

Recently I was asked, if I could read the Investors Business Daily (IBD) once a week, which day would I pick to read?  What day would you pick?

If you can only read the IBD once a week, I suggest that you get the weekend edition.  Why? The weekend edition gives you the summary of everything that happened during the week. When you look at the charts, you are seeing how stocks closed for the week.  It's like the difference between a daily and weekly chart. By the end of each week, you see how every stock reacted to the market and how any news affected your stock or industry group.  Notice in this SPY chart how 4 indicators alerted us of the pending selloff on August 20 and 21.  Time to get out of the markets.  We recently received indications that it was time to move back into the markets.  Did you notice these signals and take appropriate actions?

So, what happened in the market this past week?  The leading index this week was the S&P 600 with a 5.1% gain.  Small stocks had been had been underperforming until last week's reversal.  Like the IBD Mutual Fund Index, the S&P 600 carved out a "W" pattern.  In and of itself, that is not "actionable" information, but it does indicate that support came into the index.  If you look at the Russell 2000 ETF (IWM), there was a heavy volume reversal day on October 2.  


If you are interested in researching charts from prior market bottoms and sometimes at the bottom of a market decline, you often see a "reversal day".  You may notice that October 2 was not the low of this most recent move down, but it did test the September 29 low and then rallied strongly.  

Here are some excellent examples of weekly reversal lows for additional research:

March 14, 2003    March 13, 2009    October 17, 2014

Now with the market in an uptrend, watch how the Nasdaq or any ETF's that you own are acting at or around the 10 day moving average.  For a quick reference, look at the above examples how after a follow-through day they responded near that moving average.  I would also encourage you to once again check out September 1, 2010 and you will see how the Nasdaq and the S&P 500 marched right up to the 10 day moving average line.

We are still in the early stage of this new uptrend and it's holding nicely above the 10 day moving average line and recent breakouts continue to act well.  So far so good!


However, I encourage you to be cautious as we continue to move higher; we could have a pullback at any time.

Have a profitable week.


3 Comments
<<Previous
Forward>>

    Joe Gruender Jr.

    Numerous new features are added to InvestorsHELP.net on a frequent basis.  Keep up to date by checking this blog.

    Archives

    June 2018
    February 2018
    January 2018
    December 2017
    November 2017
    September 2016
    July 2016
    October 2015
    September 2015
    August 2015
    July 2015
    June 2015
    May 2015
    April 2015
    March 2015
    February 2015
    January 2015
    December 2014
    November 2014
    October 2014
    September 2014
    August 2014
    July 2014
    February 2014
    November 2013
    October 2013

    Categories

    All

    RSS Feed


Home
for all investors
sectorsurfer
ss meetings
subscriber's vault

novice_Cindy
blog
peeks stock forum
What's new
coming events

Disclaimer: Investors Help ("Company") is not an investment advisory service, nor a registered investment advisor or broker-dealer and does not purport to tell or suggest which securities or currencies customers should buy or sell for themselves. The independent contractors and employees or affiliates of Company may hold positions in the stocks, currencies or industries discussed here. You understand and acknowledge that there is a very high degree of risk involved in trading securities and/or currencies. The Company, the authors, the publisher, and all affiliates of Company assume no responsibility or liability for your trading and investment results. Factual statements on the Company's website, or in its publications, are made as of the date stated and are subject to change without notice. It should not be assumed that the methods, techniques, or indicators presented in these products will be profitable or that they will not result in losses. Past results of any individual trader or trading system published by Company are not indicative of future returns by that trader or system, and are not indicative of future returns which be realized by you. In addition, the indicators, strategies, columns, articles and all other features of Company's products (collectively, the "Information") are provided for informational and educational purposes only and should not be construed as investment advice. Examples presented on Company's website are for educational purposes only. Such set-ups are not solicitations of any order to buy or sell. Accordingly, you should not rely solely on the Information in making any investment. Rather, you should use the Information only as a starting point for doing additional independent research in order to allow you to form your own opinion regarding investments. You should always check with your licensed financial advisor and tax advisor to determine the suitability of any investment. Before placing any trade you should consult with a licensed broker or registered investment advisor as well as read The Characteristics and Risks of Standardized Options. Please remove all stock names and symbols from communications. HYPOTHETICAL OR SIMULATED PERFORMANCE RESULTS ("PAPER OR VIRTUAL TRADING") IN THE MODEL PORTFOLIOS HAVE CERTAIN INHERENT LIMITATIONS. UNLIKE AN ACTUAL PERFORMANCE RECORD, SIMULATED RESULTS DO NOT REPRESENT ACTUAL TRADING AND MAY NOT BE IMPACTED BY BROKERAGE AND OTHER SLIPPAGE FEES. ALSO, SINCE THE TRADES HAVE NOT ACTUALLY BEEN EXECUTED WITH CAPITAL, THE RESULTS MAY HAVE UNDER- OR OVER-COMPENSATED FOR THE IMPACT, IF ANY, OF CERTAIN MARKET FACTORS, SUCH AS LACK OF LIQUIDITY. SIMULATED TRADING PROGRAMS IN GENERAL ARE ALSO SUBJECT TO THE FACT THAT THEY ARE DESIGNED WITH THE BENEFIT OF HINDSIGHT. NO REPRESENTATION IS BEING MADE THAT ANY ACCOUNT WILL OR IS LIKELY TO ACHIEVE PROFITS OR LOSSES SIMILAR TO THOSE SHOWN.

Contact:  Joe Gruender Jr., Investors Help, P.O. Box 700032, San Jose, CA 95170                  [email protected]
Web Hosting by iPage